|
|
Fixed-Head Ergometers - Unmeasured Sliding Work
Can It be Optimized? ... (03/02/18) this article now nearly completed - tables included now but a couple of illustrations to go in ... Ever since that dark, dark day when rowing machines became widespread (I first used one in the Goldie Boathouse in Cambridge in 1983), they have been a tool, for better or for worse, for Crew Selection, with the most widespread standard being whatever is the latest fixed-head model from Concept II.
If you’ve read my other stuff here, you’ll have gathered that I am not a fan of “ergo-selection” unless that ergo is “float-head” (like a Rowperfect). Selection by fixed-head erg-test all too often produces “ergo-boats” that are unpleasant to row in and which rarely reach their potential. An anecdote: Thomas Lange, two-times Olympic Champion in the single scull, was generally “middle of the pack” or worse in Germany’s erg-tests. But when they tested using float-head ergs, Lange was a considerable margin ahead of everyone else. The dynamics of fixed-head ergs are sufficiently different from actual rowing as to potentially instil “wrong muscle-memory”, destructive to the movement-patterns and crew-coordination in a boat (by contrast, float-head ergs have rather similar dynamics to in-boat). I like to think of fixed-head ergs as “cross-training” for rowing, and would not recommend using them for technical rowing or sculling coaching. However, in the UK as of 2017 any aspiring rower or sculler must include fixed-head erg-tests as part of their pathway to selection, whether at club (unless said club is really enlightened) or national squad level. The latest Nov 2017 GB Assessment weekend included a 2000m erg-test on the Saturday and a long-distance on-water time trial on Sunday. For heavyweight men, only those who’d achieved sub 6:05 were allowed to race on Sunday. It's a bit like insisting that all freestyle swimming triallists achieve a certain standard in breastroke! So, the point of this article: given the necessity for fixed-head erg-testing, is there any way to “optimize” the way in which one uses a fixed-head machine? Well, yes, there is. Unmeasured Work - The Recovery You often hear this term in relation to fixed-head rowing machines. What is meant is as follows: at the back end of the stroke you are momentarily stationary, sitting at backstops. From there you must move your whole body “up the slide”, then decelerate back to a standstill. Both the acceleration and the deceleration require effort. This effort can only come from the rower, eating into their power capacity, but it is not measured by the machine. I repeat: the work you do getting from backstops to frontstops does not count towards your “score”. Every Watt saved from the recovery is available as extra for "pulling". The next question, obviously, is “is this ‘recovery work’ significant”? And if it is, can it be meaningfully reduced? Yes it is, and yes it can. Given a certain speed-profile for the recovery movement, and making some reasonable assumptions, a simple formula describes the work required to execute the recovery. I’ll consider two speed profiles: a typical one, the way that most people slide, and an optimum one. I’ll then compare them for various scenarios and show how much work can be saved by optimizing. < pic 1 typical > < pic 2 flat > Describing them: the typical sliding shows the speed up the slide looking like a sine curve, the erger's body's speed gradually and smoothly ascending from zero, reaching a flat peak, and symmetrically reducing again to stationary at frontstops. I’ve measured myself, I do it that way. The optimum one is “flat”. You slide up to frontstops at a constant, unchanging speed. But because you have to start from standstill, you must “get up” to that speed in the shortest time possible, so it should feel like a little jerk as you depart backstops. Training yourself to do that, and to maintain it at higher intensities, will likely require some practise. But well worth the effort, as we’ll see. The formulae for how much work is needed to execute a recovery are: PowerTypical = (M.pi2.L2.R3)/(864000.x2) or approx 1.142*10-5.M.L2.R3/x2 PowerOptimum = (M.L2.R3)/(216000.x2) or approx 0.463*10-5.M.L2.R3/x2 where M is that part of the rower's total mass that's "going up and down" (I've assumed 75% because feet stay fixed and lower leg doesn't move far...); L is the total length "slid"; R is the stroke rate; x is the proportion of slide-time to total stroke time, for example 0.25 means 25% of stroke time is spent sliding. Any similarly-derived formulae for these (and other) profiles will share a similar format but each has a different constant in front. I.e. whatever profile you adopt, “wasted power” always varies by the amount of moving mass, the square of slide-length and the cube of stroke rate (wow). There’s also a penalty for how much (x) of the total stroke-time you spend recovering: the smaller the proportion of the stroke you take, the more power is required, squared (this proportion "x" tends to reduce as the rate goes up). The derivation: the recovery work is simply double the maximum kinetic energy you achieve on the slide. Double, because you have to supply the energy to get up to speed, and then spend the same amount to reduce it to zero (at the catch). Some Observations: - Other things remaining the same, "typical" sliding will consume 2.5 times the effort of the "optimum" one. That's amazing. Expressed another way, you can save 60% of the work you do in the recovery, which will therefore be available to count towards your score. See the tables below for the full gamut. - Around 92W is what a 90kg rower rating 36 and sliding 0.8m in “typical fashion” will spend on recovery. Adopting the “flat” profile can reduce that to 37W, allowing an extra 55W for scoring. THAT’S A LOT, bearing in mind that a GB-trials-standard male rower would have available 400-450W in total. - The R-cubed term explains why people find it so much harder to rate high on the erg than in a boat, or on a float-head machine. - These results DO NOT transfer to a rowing boat. Indeed people trying to transfer erg-feel to actual rowing is one of the sport's most serious problems. There is a way to optimize the on-water recovery pattern, which I’ve described in another article, but it’s completely different, because the dynamics of on-water rowing are quite different. - C2’s score-generating algorithms may well include some adjustment/estimate for slide work, but that doesn’t change these conclusions. - It's quite possible therefore for a rower of "lesser pulling power" to optimize erg-sliding for a fixed-head test and put someone with more true power out of contention by optimizing something which has no relevance to actual boat-moving. The tables below show, for a rower of various weights and rates, producing 375W and covering 2000m in 6:30, how much power is consumed by "normal" sliding, "optimum" sliding, the difference between the two, and how much time that extra power for "pulling" would equate to.
Other Methods The discussion above is predicated on the fact that the rower must must provide all the energy needed to accelerate and decelerate the body between backstops and frontstops. There is another way, let the machine (the earth) do it for you! Simply bang into frontstops without slowing down. This will halve again the work done to execute the recovery. But I wouldn’t recommend it, for reasons that should be obvious. |
||||||||||||||||||||||||||||||||||||||||||||||||||||||||||||||||||||||||||||||||||||||||||||||||||||||||||||||||||||||||||||||||||||||||||||||||||||||||||||||||||||||||||||||||||||||||||||||||||||||||||||||||||||||||||||||||||||||||||||||||||||||||||||||||||||||||||||||||||||||||||||||||||||||||||||||||||||||||||||||||||||||||||||||||||||||||||||||||||||||||||||||||||||||||||||||||||||||||||||||||||||||||||||||||||||||||||||||||||||||||||||||||||||||||||||||||||||||||||||||||||||||||||||||||||||||||||||||||||||||||||||||||||||||||||||||||||||||||||||||||||||||||||||||||||||||||||||||||||||||||||||||||||||||||||||||||||||||||||||||||||||||||||||||||||||||||||||||||||||||||||||||||||||||||||||
|
Why do heavyweights generally beat lightweights?
Alternatively, why are Fours slower than Eights? The answer, it turns out, is the same for each question. Some would say “because the increase in power as a person (or crew) gets bigger is more than enough to overcome the increase in drag due to the extra weight.” This is right, but it doesn’t give any insight. It doesn’t say how much extra drag there would be, or by what margin the increased power available overcomes the extra drag. It doesn’t allow you to estimate how fast a triple scull should go, for example, or a six-oar. On average, or at a highly selected level, and ignoring differences between sculling and rowing and the presences of cox’ns, the following four relationships describe what’s going on in rowing: 1. Total available power is proportional to crew mass. Biomechanically, the aerobic power output of an athlete is determined by the total volume of blood that can be pumped, which is proportional to his/her volume. Since mass is also proportional to volume, this relationship applies equally to a larger person or to more than one athlete, i.e. a crew. 2. Rowing boat drag is almost entirely skin drag: a resisting force proportional to product of the frontal projected immersed area and the square of the boat’s velocity. Drag on a floating vessel moving on the surface of a fluid principally loses energy in two ways: skin drag and wave drag. Skin drag is all about wetted area, so it might seem best to try to minimize it by building a boat that has minimum wetted area for its volume. Unfortunately this would result in a hemi-spherical shell, or something like a wok with riggers. It will not go fast because a large wall of water gets pushed out in front, creating a big wake and lavishly radiating energy as waves. In contrast to the wok, 150+ years of trial and error have evolved rowing shells to be long and thin, suggesting that the vast majority of energy loss in a rowing boat comes from skin drag and very little from (more energy-expensive) wave drag. I other words, wave drag is the greater evil. 3. The frontal projected immersed area is proportional to displaced mass raised to the power of 2/3, assuming the hypothetical rower or crew is always optimally boated. 4. The power (work done per unit time) consumed by the rower+shell system is the product of drag force and velocity. Re-expressed as simple high-level equations, these four relationships are (where k1, k2, k3 are constants):
1. P = k1 . M
Combining these 4 relationships, we get2. D = k2 . A . v2 3. A = k3 . M2/3 4. P = D . v v = k1/(k2 . k3) . M1/9
and differentiating for the changes in v & M, we get dv/v = 1/9 dM/M
i.e. Velocity is proportional to the ninth root of mass (nine!), and for a given % change in mass one can expect only one ninth the % change in velocity.
At first glance, this is an extraordinary result, such “high power” equations are rare in “simple” physics.
Immediately some conclusions and applications spring to mind. Remembering that the initial equations are describing things on average, the result is saying that on average, boat velocity should only increase by one-ninth the rise in mass. This is a case of tremendous diminishing returns, so there is plenty of scope, as a lighter rower or crew, to overcome this “size disadvantage” by simply having better technique, and sure enough we see this all the time. Also, if we know the speed of just one “typical” rower or crew, we can estimate how fast that rower or crew should go if they were either scaled up by, say, 15%, or if 4 of them were to form a crew. Or I can compare how fast I should be if I cloned myself into a double, with how fast a double with a new partner actually goes. In fact, the constants in equations 2 & 3 lump together terms such as water density, coefficient of drag and the shape of the shell, all of which are safe for our purpose to keep constant. But the constant k1 in equation 1 (P = k1.M) can be regarded as a “talent” constant, describing an athlete, average or otherwise, that can produce P/k1 Watts from M kg of mass. (footnote: cyclists may recall the ubiquitous “watts per kilogram” talent-measure in cycling, ironically a less good measure for cycling than it is for rowing, for reasons I might talk about elsewhere). Bearing k1 in mind, the result can also usefully be used to describe things at a specific level, that is to say it might apply, rather than to the average, but to one or more particular values of this talent constant. It could (and should) be used, for instance, to produce a consistent set of gold medal standard times. NB Beware of misinterpreting this result, what it’s not saying is that if you suddenly lose 5kg you’ll go a certain amount slower (see next paragraph for that result). This is saying that a different weight is associated with a different cardio-vascular volume and therefore a different capacity to produce power. The table at the bottom shows “equivalent 2000m times” for various crew weights and boat types. For example (see yellow boxes), if you can do 6:37 in a 2x and you’re 85kg, the equivalent 85kg quad should go 6:08. The Effect on Speed of Simply Changing Weight i.e. Holding Power Constant We can use almost the same equations to model a specific crew or sculler under different weight scenarios. We simply drop the first relationship which says that power varies with mass, and use P as a constant instead of a variable in equation 4. The resulting relationship between velocity and mass now changes markedly, to become v = (P/k2.k3)1/3 . M-2/9
and dv/v = -2/9 . dM/M Note here that speed now decreases with increase in mass for the same power, as you’d expect! Increasing the mass (for same power) yields a % speed reduction of 2/9ths of the % mass increase. This is a useful rule of thumb, in conjunction with the “variable power” equations above, to construct tables of estimated times for heavier boats, for instance where a cox has been added. Tables of Estimated Equivalent Speed - the same position within each table is "equivalent":
1x Single Scull
2x Double Scull
3x Triple Scull
4x Quadruple Scull
8+ Eight-Oar (-2% adjustment made to "power constant" k1 due to lower efficiency of oars vs sculls)
|
||||||||||||||||||||||||||||||||||||||||||||||||||||||||||||||||||||||||||||||||||||||||||||||||||||||||||||||||||||||||||||||||||||||||||||||||||||||||||||||||||||||||||||||||||||||||||||||||||||||||||||||||||||||||||||||||||||||||||||||||||||||||||||||||||||||||||||||||||||||||||||||||||||||||||||||||||||||||||||||||||||||||||||||||||||||||||||||||||||||||||||||||||||||||||||||||||||||||||||||||||||||||||||||||||||||||||||||||||||||||||||||||||||||||||||||||||||||||||||||||||||||||||||||||||||||||||||||||||||||||||||||||||||||||||||||||||||||||||||||||||||||||||||||||||||||||||||||||||||||||||||||||||||||||||||||||||||||||||||||||||||||||||||||||||||||||||||||||||||||||||||||||||||||||||||
|
Ergo Score as a Predictor of Boatspeed
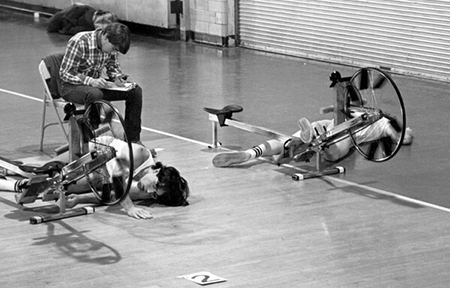
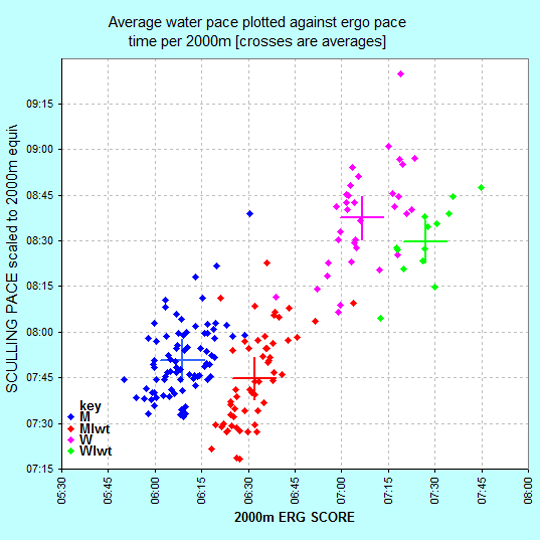
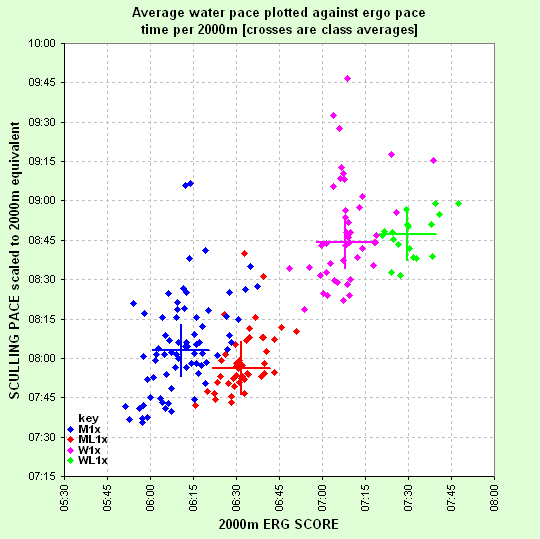
-- UPDATED with Oct 2010 GBR trials data Alternatively phrased: "Do Ergs Float?" Each year at the first GB National Trials at Boston, candidates are required to do an ergo test and a 5km "out & back" time trial in a single within the same weekend. This is a great opportunity to get data linking ergo and boatspeed for a wide variety of abilities and across all four classes (M MLwt W WLwt). I have taken the data from 2010, 2007 and 2006 and plotted boatspeed against ergo score for all competitors omitting only extreme outliers. The water was quite rough for the 2006 trials, which will have exaggerated the spread of boatspeeds. The conditions at the 2007 and 2010 trials were much more benign. Also,in each case actual GB team members from the previous year's World Championships were excused, so the data represent a cross-section of the upper levels of club sculling in GB at the time. Looking at the charts, there are several interesting observations: Answer: Ergs do AND do not float Very broadly, they do float: across ALL the competitors, erg score does correlate to boatspeed, evidenced from the fact that the data points across all classes spread broadly from bottom left to top right. Put another way, it is reasonable, given the data, to expect a heavyweight male to beat a lightweight female in a sculling boat. But, within smaller groupings, ergo score is a A fascinating feature of the data is that in all three years now plotted, with barely one exception, lightweights have on average been faster on the water than heavyweights. (On the erg, in all cases the "correct ordering" holds). Bear in mind that these data represent aspiring team candidates, as at first trials actual GB Team members are excused. So we are looking at mid-top club standards in the UK.
Chart: Boston GB Squad Trials Oct 2010 - Ergscore vs Boatspeed. |
||||||||||||||||||||||||||||||||||||||||||||||||||||||||||||||||||||||||||||||||||||||||||||||||||||||||||||||||||||||||||||||||||||||||||||||||||||||||||||||||||||||||||||||||||||||||||||||||||||||||||||||||||||||||||||||||||||||||||||||||||||||||||||||||||||||||||||||||||||||||||||||||||||||||||||||||||||||||||||||||||||||||||||||||||||||||||||||||||||||||||||||||||||||||||||||||||||||||||||||||||||||||||||||||||||||||||||||||||||||||||||||||||||||||||||||||||||||||||||||||||||||||||||||||||||||||||||||||||||||||||||||||||||||||||||||||||||||||||||||||||||||||||||||||||||||||||||||||||||||||||||||||||||||||||||||||||||||||||||||||||||||||||||||||||||||||||||||||||||||||||||||||||||||||||||
|
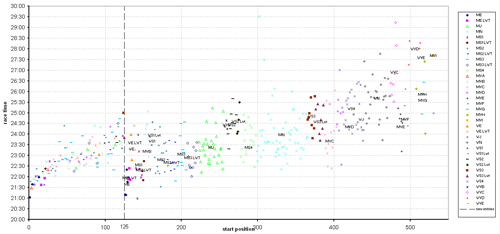
Scullers Head Start Order
In 2007 I returned to the Scullers' Head of River Race after a gap of several years. I entered VetC as a new entry and was surprised to discover that my start number was 394 out of ~450, and the Mens VetCs were starting behind Womens Sen3 Lwt and Womens Sen3. I, and many around me, spent the entire race overtaking firstly small women, then less-small women. I thought to myself, "the starting order for the various categories doesn't seem to reflect their speeds". So I decided to look at the results data for the last few years. I have plotted, for each sculler, race time on the y-axis against start position on the x-axis. Each sculler has been assigned a symbol corresponding to his/her entry category, including those starting in the top 100. Also, each category marker shown on the graph (e.g. "MVC") represents the average race time and start position for that category.
I have suggested (below) a category starting order consistent with the average category speeds based on the last three years' results. Taking account of the ARA's new 2009 category names, a starting order that would match reasonably well the expected times of the scullers based on the last 3 years' results would be: E, sen, IM1, IM2, VA, VB, WE, IM3, N, J18, VC, Wsen, VD, WIM1, WIM2, VE, VF, WIM3, WJ18, VG, WN, WVA, WVB, VG, WVC, VH, WVD, WVE, VI NB the odd shape of the 0-120ish on the charts reflect the tradition for this race that, regardless of category, if you are good enough to finish in the top 125 or so (the number varies), you get to keep the same starting position for the following year. Otherwise, you will be classified as a "new entry" and will have to start in the batch appropriate to your category. |
||||||||||||||||||||||||||||||||||||||||||||||||||||||||||||||||||||||||||||||||||||||||||||||||||||||||||||||||||||||||||||||||||||||||||||||||||||||||||||||||||||||||||||||||||||||||||||||||||||||||||||||||||||||||||||||||||||||||||||||||||||||||||||||||||||||||||||||||||||||||||||||||||||||||||||||||||||||||||||||||||||||||||||||||||||||||||||||||||||||||||||||||||||||||||||||||||||||||||||||||||||||||||||||||||||||||||||||||||||||||||||||||||||||||||||||||||||||||||||||||||||||||||||||||||||||||||||||||||||||||||||||||||||||||||||||||||||||||||||||||||||||||||||||||||||||||||||||||||||||||||||||||||||||||||||||||||||||||||||||||||||||||||||||||||||||||||||||||||||||||||||||||||||||||||||
|
How to Pace for Different Distances
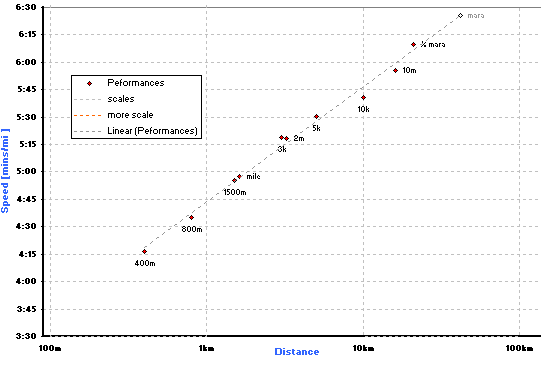
A question you often hear discussed amongst rowers/ergers goes along the following lines: "I can do 1:20 for 500m flat out and 1:43 for 5000m ... so what should I aim for for, say, 2000m? Or an hour?". It turns out, looking at actual data from both running and erg-ing, that a useful general rule is: DOUBLE THE DISTANCE ... ADD THE SAME AMOUNT OF TIME PER 500 (or mile). Or expressed as a ("log-linear") formula, using 2 representative performances:
Target_Pace = P1 + (P2-P1)/(log(D2) - log(D1))*(log(Target_Dist) - log(D1))
where P1,D1 and P2,D2 are two sets of representative pace and distance (which perhaps you've already done) Target_Dist is the new distance for which you need to estimate a pace. Look at the following chart, showing actual recent PB performance data from a friend who started running only a few years ago (2006) and has raced almost every conceivable distance several times since then. She has not yet run a full marathon, though, so this suggests that she has the potential to run a sub 2:50 (although marathons being what they are it may take her a few attempts to achieve it!)
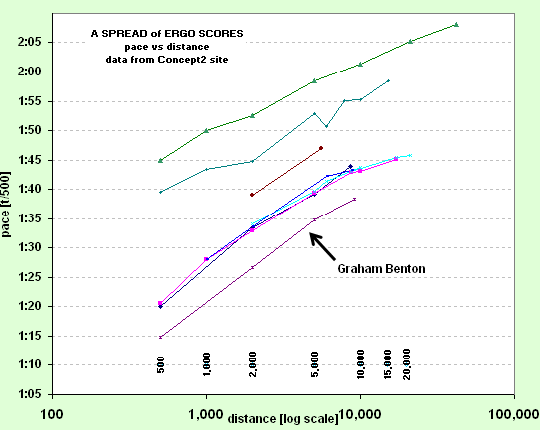
To expand in words: say another (slightly slower!) hypothetical runner can run a single mile flat out in 6 minutes (6 mins/mile) and two miles in 12:40 (6:20/mile), using this rule you could expect to run four miles at 6:40/mile, eight miles at 7:00/mile, sixteen miles at 7:20/mile and thirty-two miles at 7:40/mile. i.e. a half-marathon in something slightly better than 1hr36 (7:20 pace) and a marathon something inside 3hrs21 (7:40 pace). APPLIED TO ERGO SCORES Closer to home, look also at the chart below, this time of various ergo scores using a selection of data taken from acquaintances and from the Concept 2 ranking site, showing a similar law at work. The bottom line is Graham Benton's data, very close to world best on the ergo.
Generally and more technically, if you plot pace (e.g. t/500 or mins/mile) against the logarithm of total distance, you can see a strong relationship that connects performances over very short distances to those over very long ones. This relationship is not apparent if you simply plot pace against distance because the short distances all tend to bunch together and the long ones stretch out way too far, plus to make matters worse the line that would connect them is curved. |
||||||||||||||||||||||||||||||||||||||||||||||||||||||||||||||||||||||||||||||||||||||||||||||||||||||||||||||||||||||||||||||||||||||||||||||||||||||||||||||||||||||||||||||||||||||||||||||||||||||||||||||||||||||||||||||||||||||||||||||||||||||||||||||||||||||||||||||||||||||||||||||||||||||||||||||||||||||||||||||||||||||||||||||||||||||||||||||||||||||||||||||||||||||||||||||||||||||||||||||||||||||||||||||||||||||||||||||||||||||||||||||||||||||||||||||||||||||||||||||||||||||||||||||||||||||||||||||||||||||||||||||||||||||||||||||||||||||||||||||||||||||||||||||||||||||||||||||||||||||||||||||||||||||||||||||||||||||||||||||||||||||||||||||||||||||||||||||||||||||||||||||||||||||||||||
|
SlidingSeat.net / Magnus Burbanks / member of Molesey Boat Club, UK
|
|
Is the effort required to "do the recovery" on an erg significant? And if so, can it be optimized? Yes,
it can, and quite significantly There are four simple relationships/equations that broadly describe rowing that when combined, answer these two (actually they're the same) questions.
The resulting estimator is useful, and I also provide "tables of equivalence" (how fast would a 3x go?) The first GB team trials each year feature a 2k erg test and a 5k sculling-boat time trial.
This article analyses the results data from 2010, 2007 and 2006 and tries to answer the question: "Do ergs float?". Analysis of the starting order for the 3 most recent Vesta Scullers Heads of River suggests
a revamp of the category starting order, to reduce wholesale overtaking during the race. A method, which will likely apply to any endurance sport, for deciding what pace to
expect for distances you haven't done yet based on what you have already done at different distances. Illustrations are
drawn from ergo scores and running. |